Debugging Starter
This guide is aimed at self-hosted users and developers.
If you're a Pro user using the hosted instance, then contact support, and we will resolve the issue for you.
Debugging
- Confirm that you've correctly followed the setup, either in the Developing Docs or Self-Hosting Docs
- And ensure you are using the latest version of Domain Locker / Docker / Node, etc
- Check the logs (see Checking Logs for instructions) to deduce if:
A) A domain locker issue, in which case check the source code (see below)
B) A third-party issue, in which case check the Third-Party Docs - If applicable, check the Service Status for ongoing issues or maintenance
- If the web app loads, but data does not work, then check:
A) The database connection, which can be tested at/advanced/database-connection
B) The backend/API using/advanced/diagnostic-actions
C) The client app's logs, at/advanced/error-logs
Reporting
If you're unable to resolve the issue, and you believe it is a bug with Domain Locker, you can report it to us via our GitHub Issues page. (Note that there is no guarantee of a response or fix)
Please include the following information in your report:
- Steps to reproduce the issue
- Expected behavior
- Actual behavior
- Any error messages or warnings
- Your system information (OS, Browser, etc)
- Any other relevant information
- Screenshots or videos if possible
- If you're a Pro user or sponsor, please mention that in your report
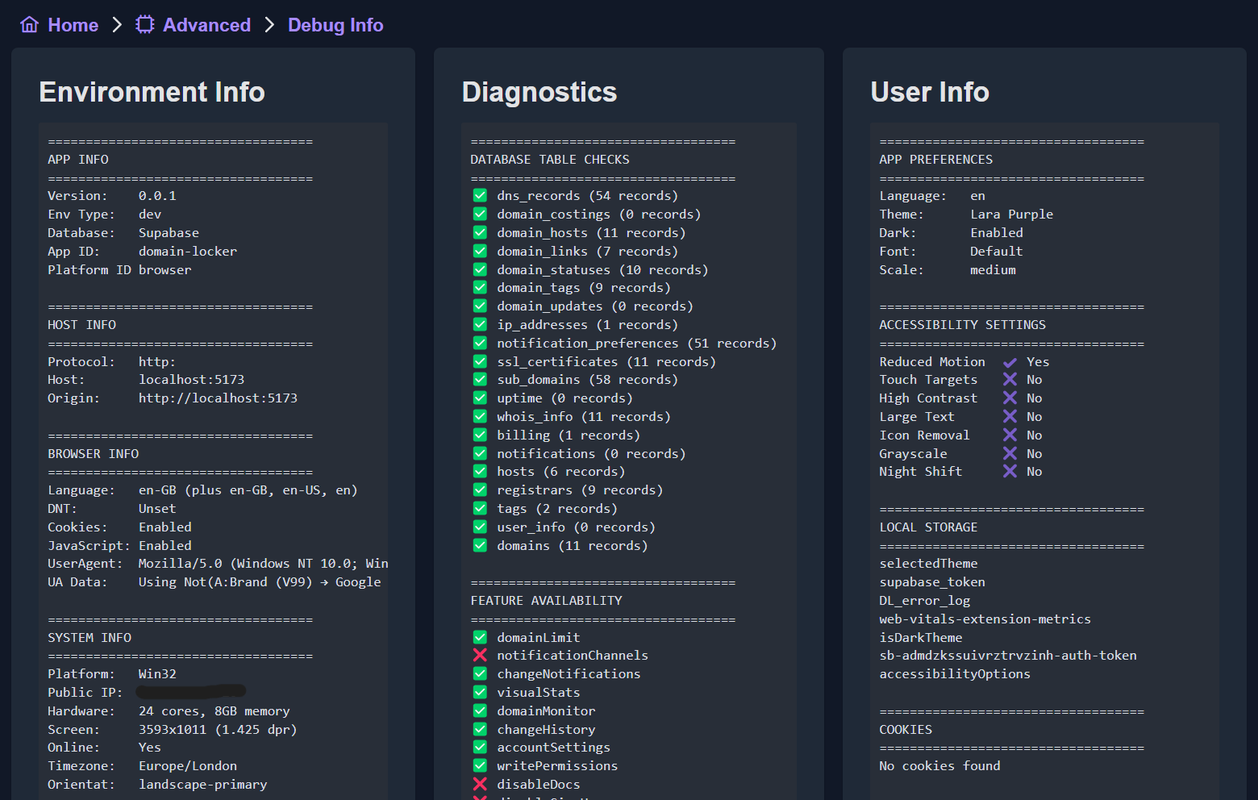
Important: In your report, you must also include the output of the environment details, error log and diagnostic report which you can find on the
/advanced/debug-info page.
Debug Tools
We've taken the time to build out a suit of embedded debugging and diagnostic tools, built into the app, to make building features, fixing issues, and understanding the app easier for developers and users alike. These can be accessed via the /advanced page.
- Log Viewer - recent errors, build logs and guides for runtime logs
Path:/advanced/error-logs - Service Status - current status for frontend app, API, database, crons and third-party services. This also shows historical uptime and upcoming maintenance
Path:/advanced/status - Debug Tool - client, server, database and user info. This data should be included when raising a bug report
Path:/advanced/debug-info - Diagnostic Actions - execute scripts to fix, test and debug common issues relating to data updates and your user configuration
Path:/advanced/diagnostic-actions - Database Connections - view and edit which database the app is connected to, and test the connection
Path:/advanced/database-connection - Admin Links - links to all third-party services, settings and dashboards, as well as docs and sources for developers
Path:/advanced/admin-links
Checking Logs
For instructions on how to view and understand the logs, see Checking Logs.
Checking Service Status
We have a dedicated status page which you can view here: Status Info.
Known issues, current outages and scheduled maintenance will be listed here. It also has live data on the current health of the app, as well as build info and third-party disruptions.
Common Issues
We've documented common issues and their solutions (or workarounds) in the Troubleshooting guide.
Source Code and Docs
If you have found a bug, either in Domain Locker, or a related package/service, then the method of finding and fixing the issue will be through reading or the source code and/or documentation.
- Client app and API: github.com/lissy93/domain-locker
- Supabase config, schema and functions: github.com/Lissy93/dl-sb-iac
- Docs for understanding and using the source code: Dev Docs
- Dependencies and third-party docs: Docs
Support
Assistance is available for Pro users and GitHub Sponsors. But unfortunately we are unable to guarantee individual support for free or self-hosted users, due to resource constraints.
For businesses or teams running self-hosted instances, we offer dedicated paid support packages. If you're interested in tailored support for your organization, please get in touch.
 Screenshot of Debug Tool